
Billy Joel says you have to get it right the first time, that’s the main thing. But I beg to differ. Sometimes it takes several tries before I get it right.
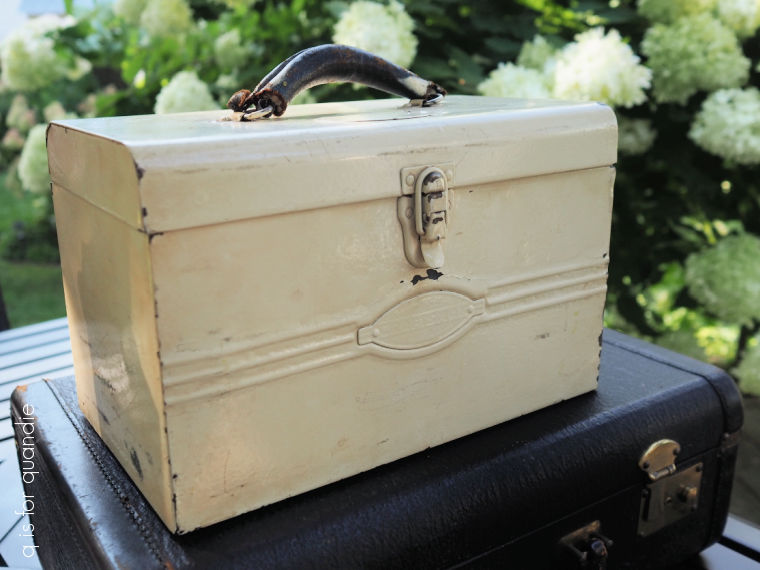
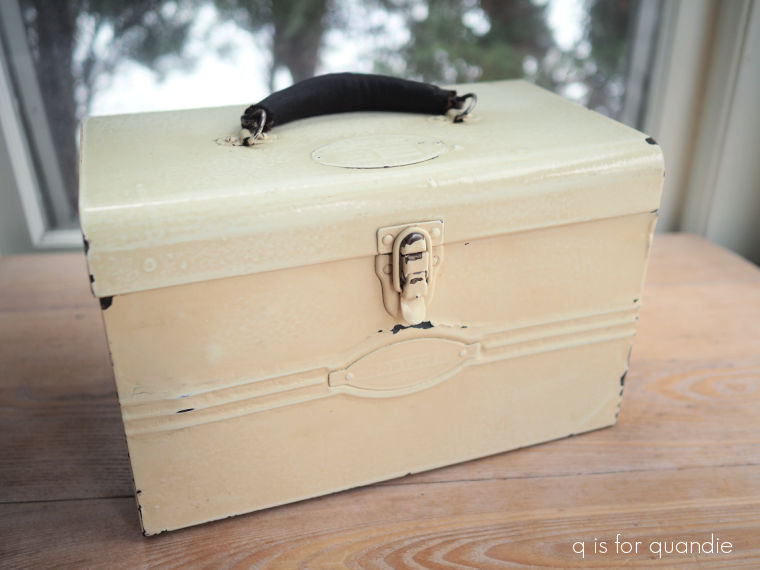
Such was the case with this 1:12 scale trunk.

Now, what I should have done is take photos of each attempt so that I could share them with you, but I didn’t do that. Drat!
But I can tell you that I initially painted this trunk in Dixie Belle’s Drop Cloth, which was a bit boring. But it was intended to work as a bed side table in the guest room of the dollhouse, and both the bed and the armoire already have a lot of detail to them.

But when I put the trunk in the room, it was both too plain, and too ‘matchy’ since both the bed and the armoire are also painted in Drop Cloth.
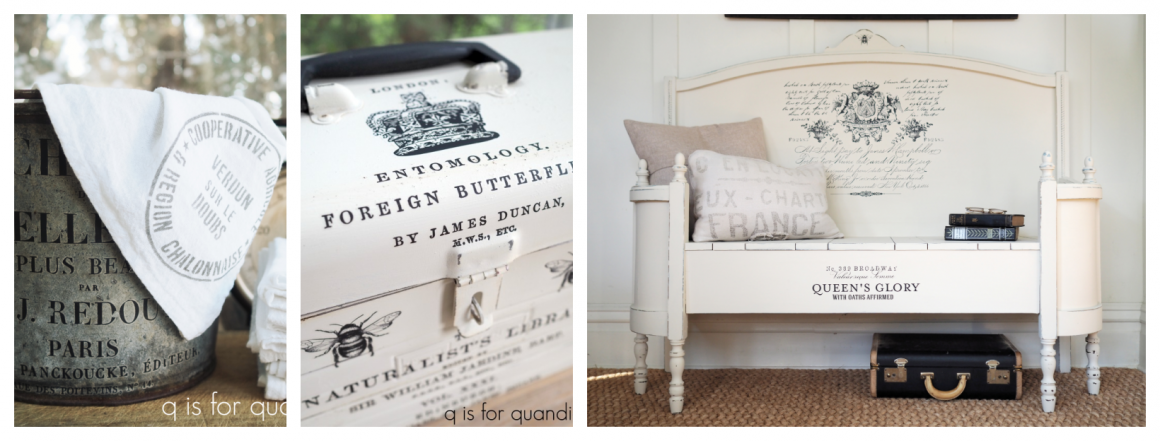
So then I thought it might be fun to decoupage one of the Tim Holtz Worn Wallpaper Scraps around the outside of the trunk. So I picked one out, and used Mod Podge to apply it. And then I put the trunk back in the room, and realized that the floral wallpaper was too much. It overpowered the more subtle transfers on the bed and armoire.
So I used warm water to help me scrape that paper back off the trunk, and then I painted it in Dixie Belle’s Sawmill Gravy. I thought maybe that would be enough of a color difference to work next to the Drop Cloth pieces.
That would have worked OK, but it didn’t wow me.
So that’s when I decided that maybe the trunk just wasn’t going to work in that room, and I should just do whatever I wanted with it not knowing where it would end up.
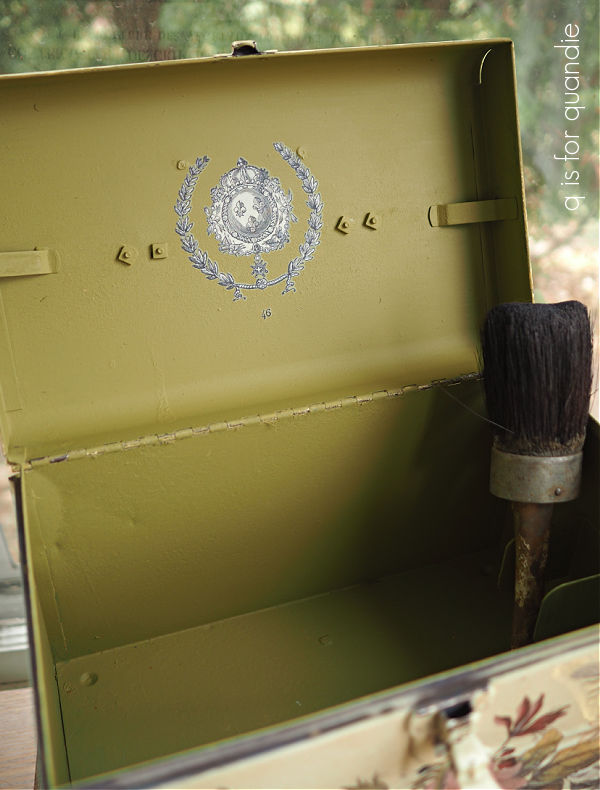
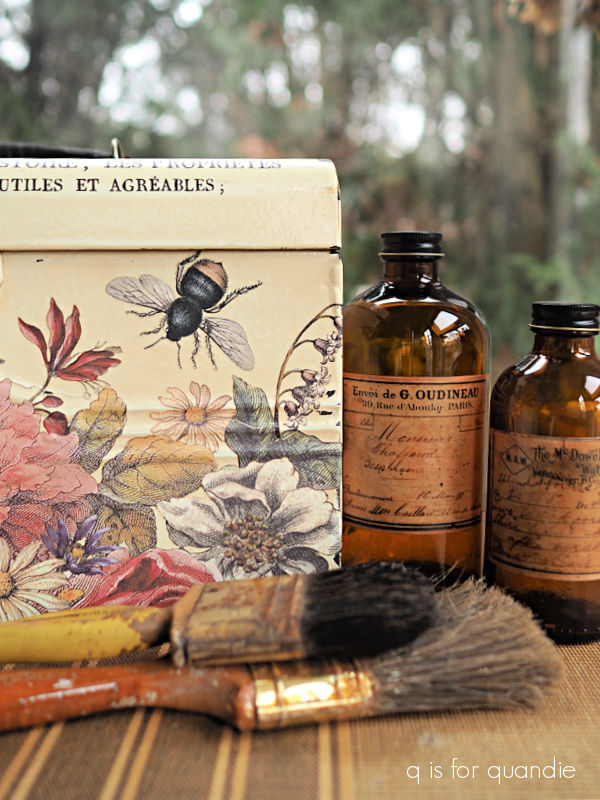
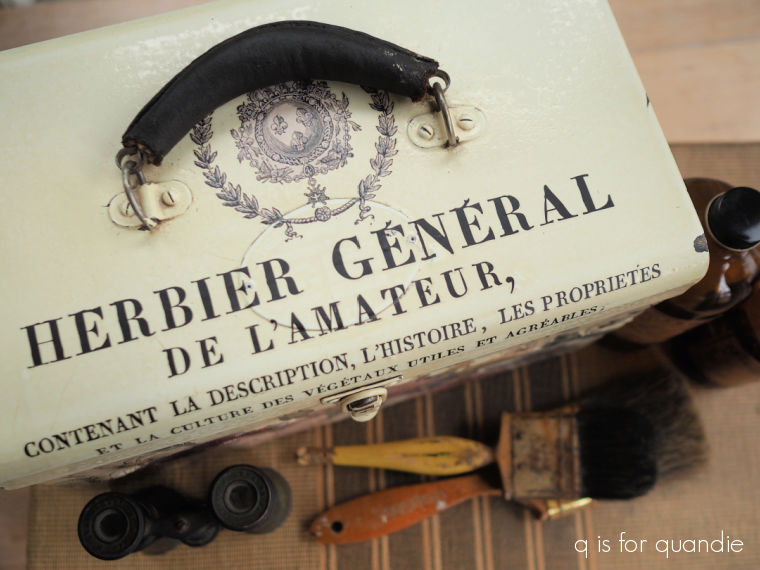
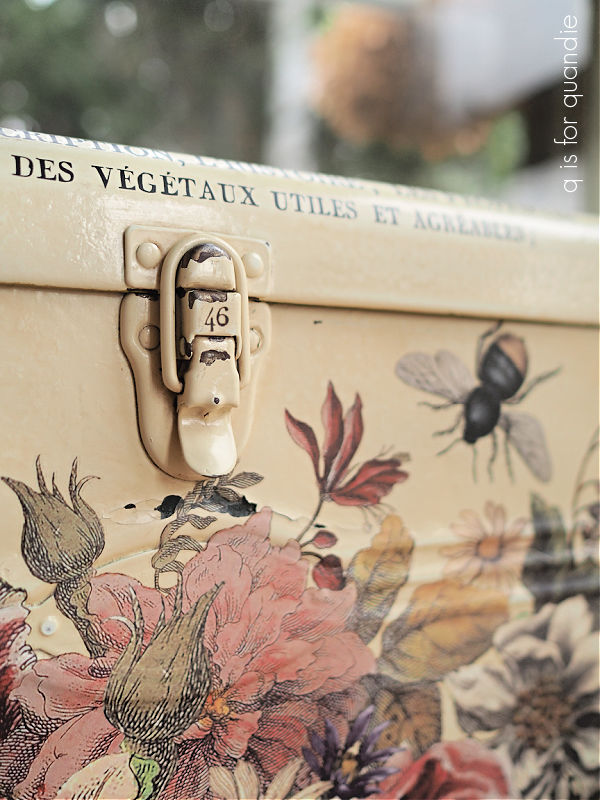
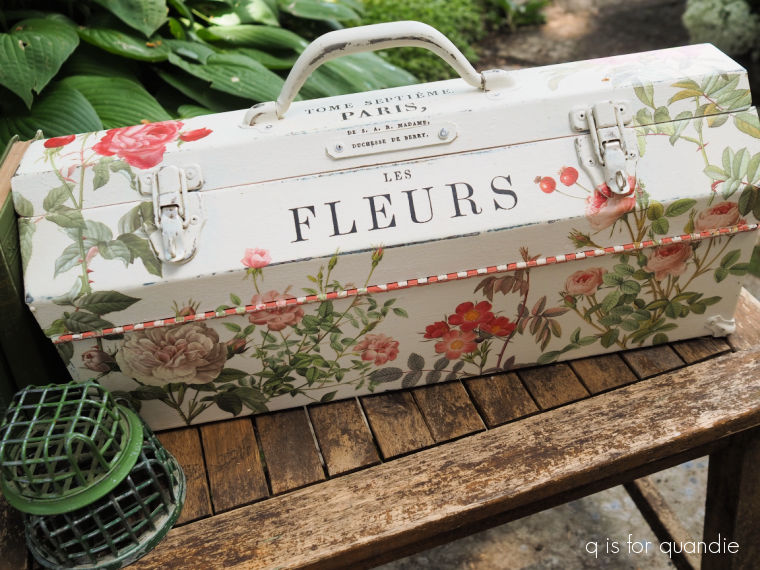
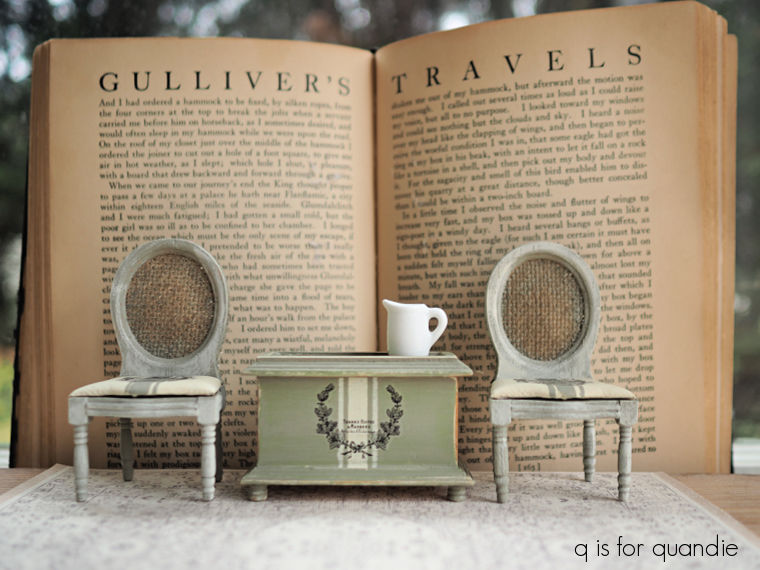
So I painted it in Dixie Belle’s Dried Sage. Then I used my super skinny tape to mask off some grain sack stripes that I painted in Drop Cloth. Once everything was dry, I sanded to distress and then added one of the re.design with prima knob transfers.
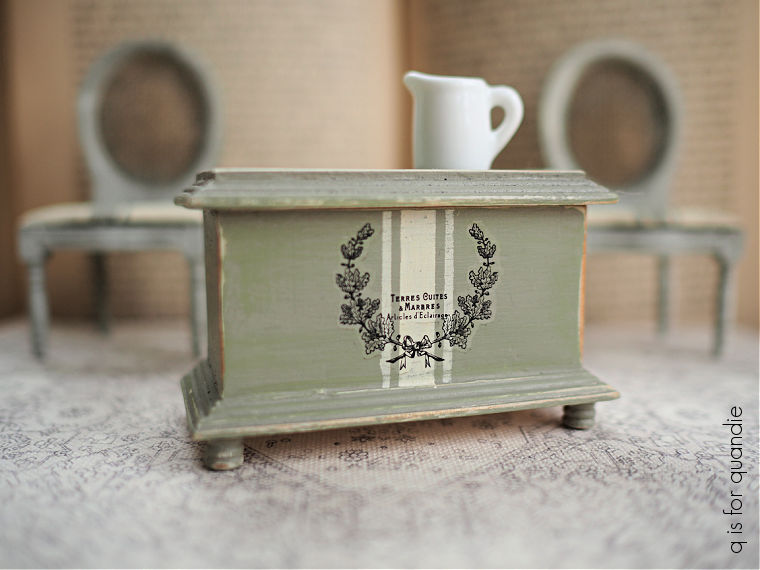
I finished off the outside with some of Dixie Belle’s Big Mama’s Butta.
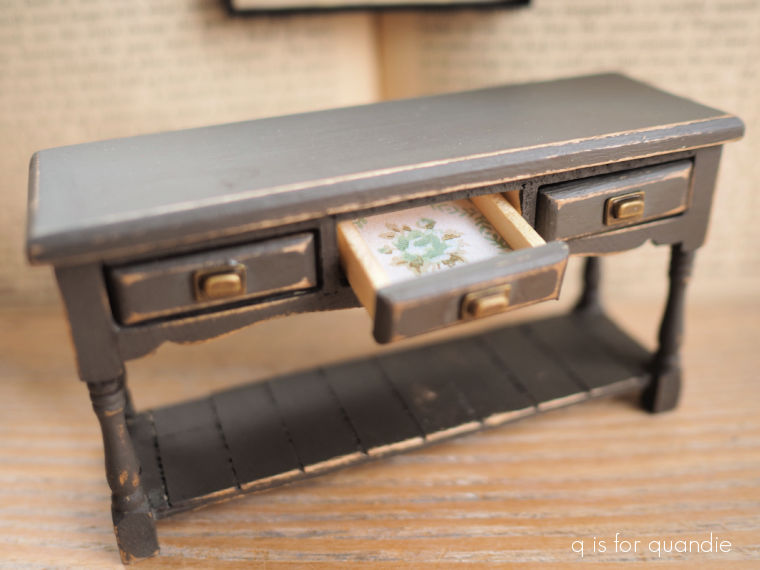
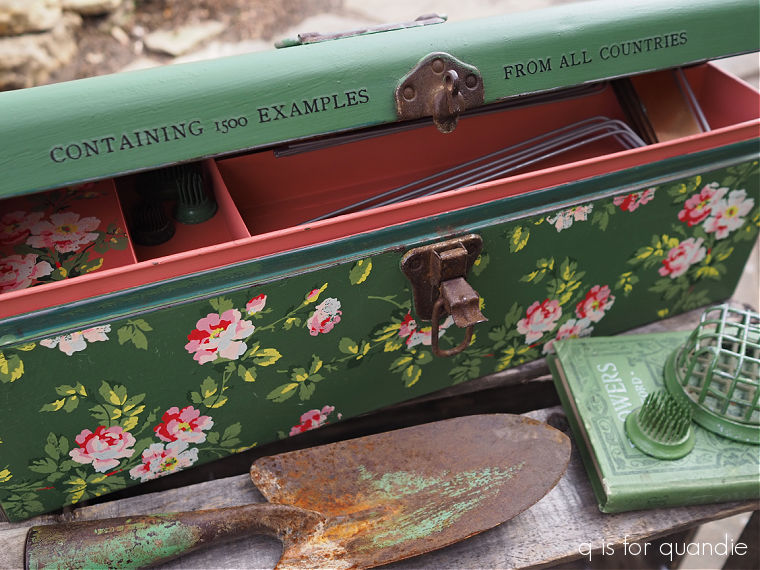
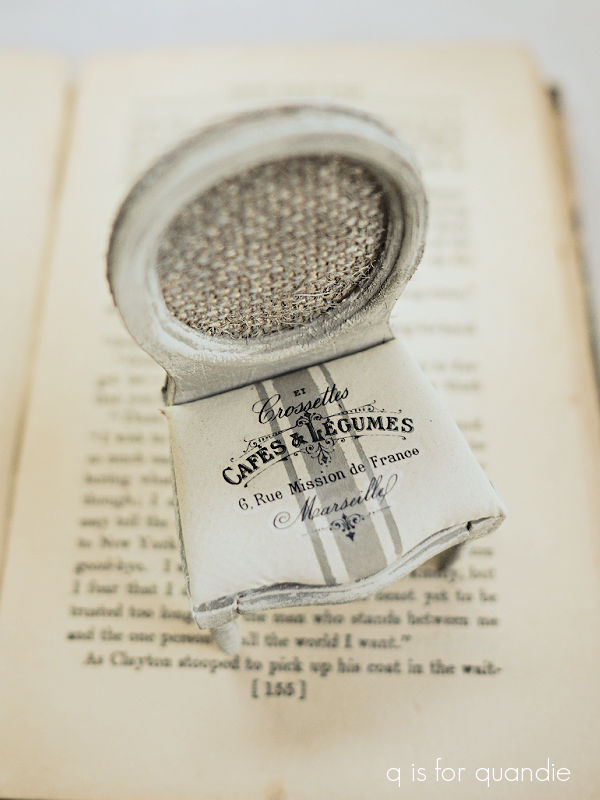
As for the inside, I left that painted in the Sawmill Gravy, and I used one of those Worn Wallpaper Scraps to line the bottom.

Sweet. But probably no one will ever actually see the inside of the trunk.
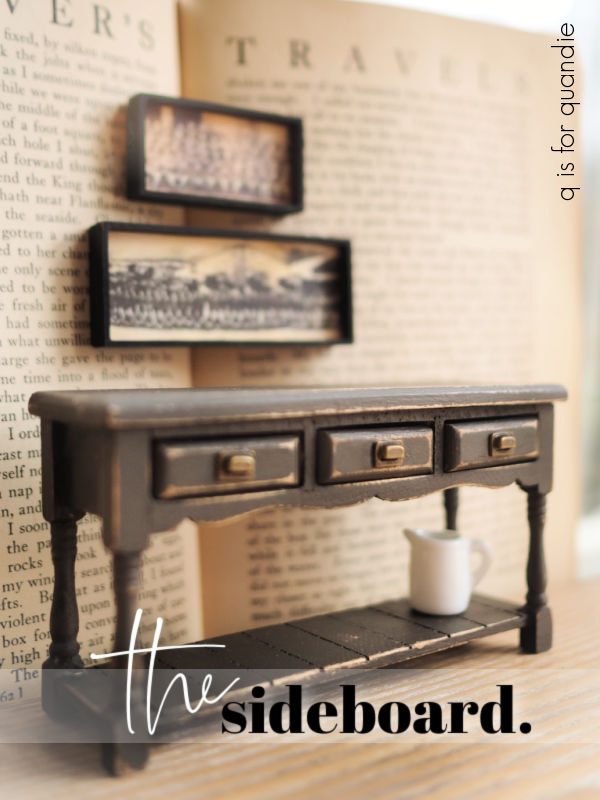
While I had my paint out, I also painted up two more chairs for the dining room. I decided that I wanted two extra chairs to sit on either side of the sideboard, as well as four chairs for around the table.
In case you don’t remember, here is what the original set of 4 dining room chairs look like.
Unfortunately, I used up the last of that particular re.design with prima knob transfer on that set.
But I decided that I could paint up two more chairs in the same colors and style (here are the full details on that project), and then add a different knob transfer and they would still work.

I have to confess, I got a bit sloppy with those grain sack stripes this time around.
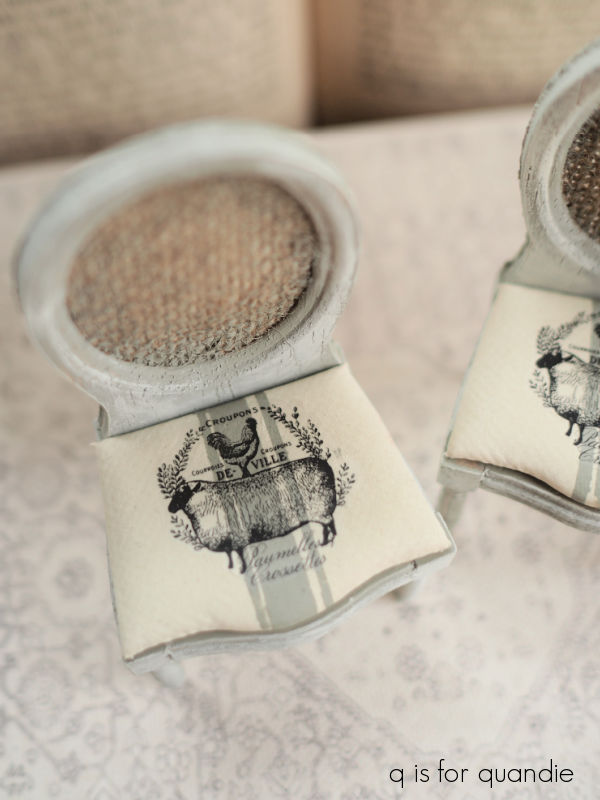
But that’s OK, that transfer helps disguise them a bit. And these chairs will be tucked under the table for the most part.
Speaking of which, on Friday I’m going to share the reveal of the full dining room makeover! So be sure to check back!